Day 11
Foolish Trader Journal, Day 11
Yesterday, I wrote about my plans of the week. See here where I said I wanted to sell volatility and buy stability.
Once again, my regular job came in the way, and I could only spend 10 minutes trading today, about 9:40 AM - 9:50 AM EST. The issue now seems to be I am unable to think too much about delta or other indicators when entering a trade. Today's trades was something I executed using my instincts, and not necessarily by some clever algorithm
I ended up betting nearly half of this portfolio on a couple of week and two-week long bets.
Portfolio Overview
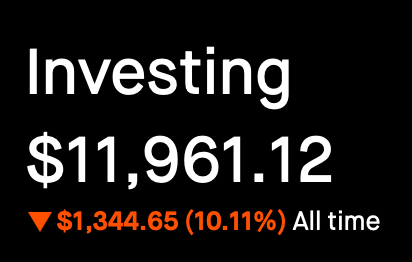
- Market Value: $11,900
- Cash: $5,400
- Options Collateral: 6,500

Today's Trades
- Chipotle - CMG $55 Put 2/7
- Received $135 Premium
- Microsoft - MSFT 385-395 Put Credit Spread
- Received $129 Premium
- I am a little skeptical about this trade. The last time I executed a Put Credit Spread on MSFT, I got burned. Hoping for a different outcome this time since this trade was not executed around earnings, which the last trade was.
Ongoing Positions
- The ones opened today.
History Insights
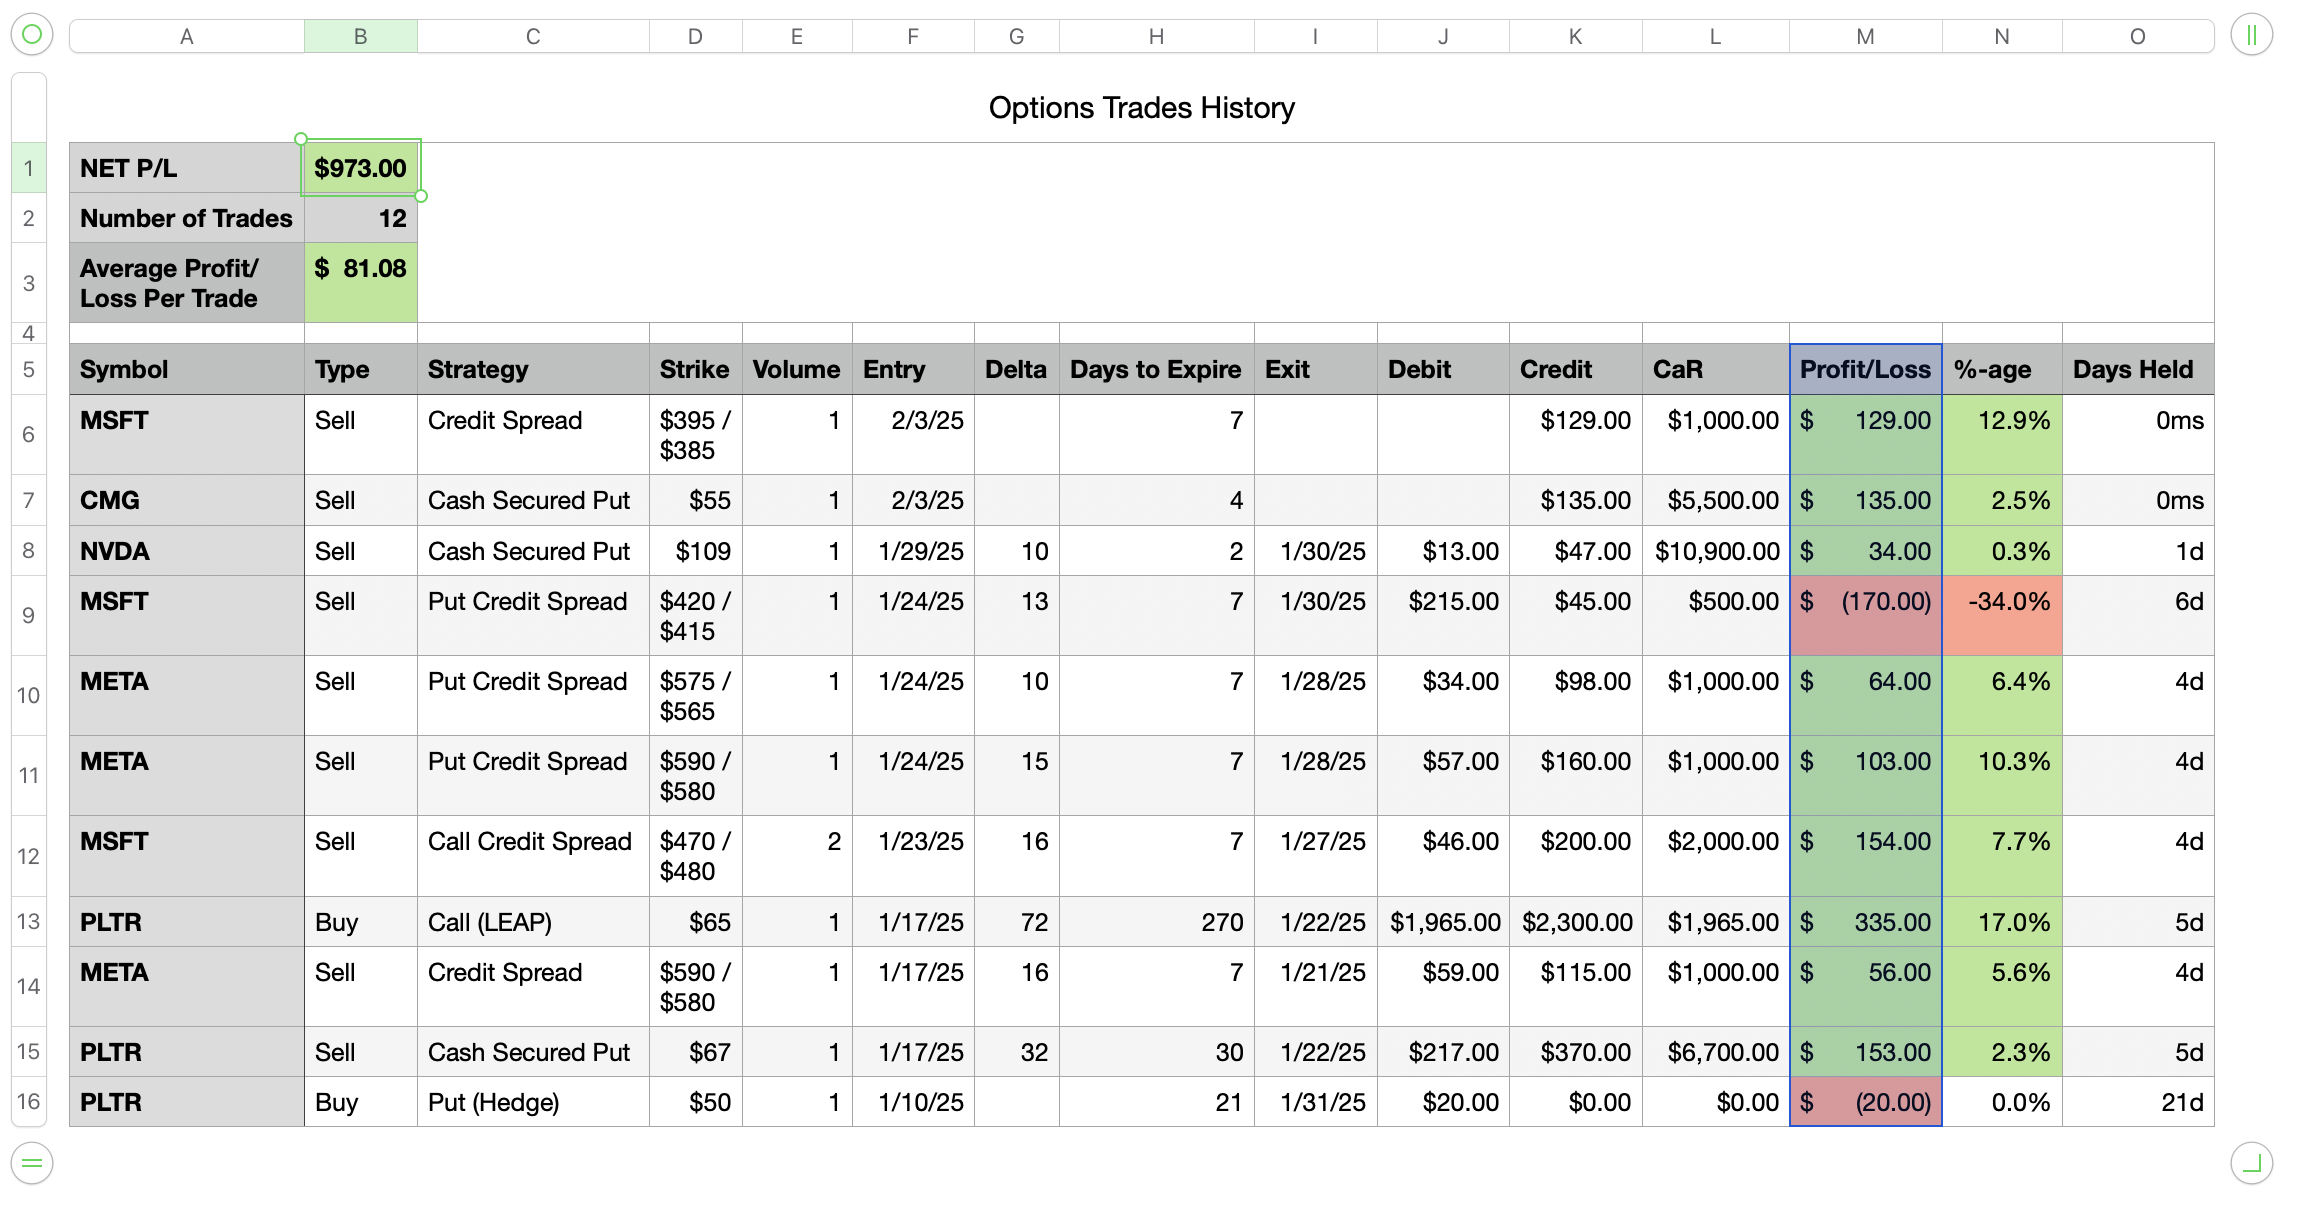
Here are my most recent trades reflecting the above positions in a spreadsheet format.

This history is not having enough data points, but here are the insights so far.
Overall Performance:
- Net P/L: $973.00
- 12 trades total
- Average P/L per trade: $81.08
- Success rate: 10 profitable trades, 2 losing trades
Strategy Patterns:
- Predominantly selling options (10 out of 12 trades)
- Heavy use of credit spreads and cash-secured puts
- Focus on tech stocks (MSFT, META, NVDA)
Risk Management:
- Most positions held for short periods (0-6 days)
- Consistent position sizing (mostly 1 contract)
- Moderate capital requirements ($1,000-$10,900 per trade)
Profitability:
- Best performing trade: PLTR call (LEAP) with $335 profit (17% return)
- Largest loss: MSFT put credit spread with -$170 (-34%)
- Most trades showing 2-13% returns
Monte Carlo Simulation
Based on current trades, here is how a Monte Carlo simulation looks like after 30 years of trades for above portfolio. The simulation also shows some rough timelines would those volume of trades need based on current trends
Again I realize there is not enough samples, but here are the key findings from the simulation with current trading strategy:
Short-term (100 trades / ~8 months):
- Median balance: ~$9,100
- High variance, but limited downside risk
- Most paths show positive returns
Medium-term (1000 trades / ~7 years):
- Median balance: ~$82,000
- Increasing path divergence
- Some paths show significant outperformance
Long-term (4320 trades / 30 years):
- Median balance: ~$350,000
- Extreme path divergence
- ~20% paths show >$1M final balance
- ~10% paths show significant drawdowns
Risk considerations:
- Current strategy shows positive expected value
- High volatility suggests need for position sizing adjustment
- Possibly reduce trade size to 0.5-1% of portfolio for sustainability

