2024 - 1099
I have been trading options off and on for a while. Before 2024, the total volume of trades I had placed was quite low.
Last year, I placed many more. But I didn’t document any. And I was not following any set plan.
Last weekend, I received my 2024 1099.
I downloaded it and got curious as to what questions should I chase down with this data. I redacted my personal information and fed it to Claude (https://claude.ai/) to check if I can get a table/CSV out of the PDF. And got a response back saying the file was too large and that I should try the same step but with screenshot of individual pages.
I tried that too, and then it asked me to pay some money to continue using it or come back later to finish the job. Not interested yet in paying.
I asked Perplexity about file size it could handle and it thought It was Google.

I then tried ChatGPT and it was willing to let me upload a file and perform some analysis.
ChatGPT kept getting the calculations wrong until I stumbled into the right motivation it needed. I just gave it the total amount I saw in the spreadsheet and asked it to keep track of that total to ensure it was on track.
With that, let's look at the real data and then some AI powered analysis.
Short Trades Summary
Here is a summary screenshot from my 1099, trimmed to show only short term trades.

I made approximately $6200 USD. Out of those, when I filtered to only see the Option trades, I see that I made approximately $1700.
A.I. Insights
The following section was generated by ChatGPT.
✅ Total Net P/L: $1,699.70
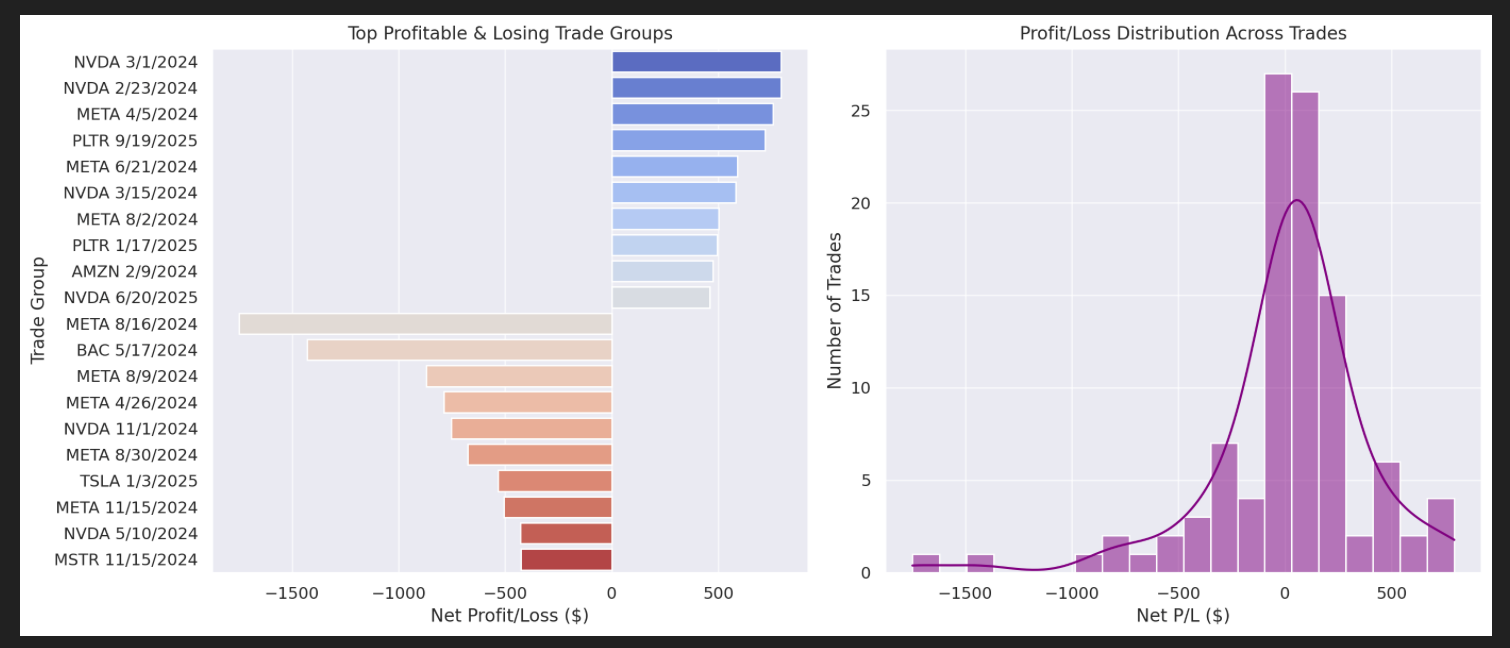
Top Profitable Trade Groups:
- NVDA 3/1/2024: +$793.82
- NVDA 2/23/2024: +$793.52
- META 4/5/2024: +$756.96
- PLTR 9/19/2025: +$719.84
- META 6/21/2024: +$589.83
Biggest Losing Trade Groups:
- META 8/16/2024: -$1,747.80
- BAC 5/17/2024: -$1,430.06
- META 8/9/2024: -$870.53
- META 4/26/2024: -$788.32
- NVDA 11/1/2024: -$753.45
Visual Insights

- Top Profitable & Losing Trade Groups (Left Chart)
- NVDA (3/1/2024) and NVDA (2/23/2024) were the biggest winners.
- META (8/16/2024) and BAC (5/17/2024) were the biggest losers.
- You have multiple winning and losing trades in META and NVDA.
- Profit/Loss Distribution (Right Chart)
- Most trades cluster around small profits/losses, with a few large outliers.
- The distribution is slightly skewed towards losses, meaning a few bad trades had a significant impact.
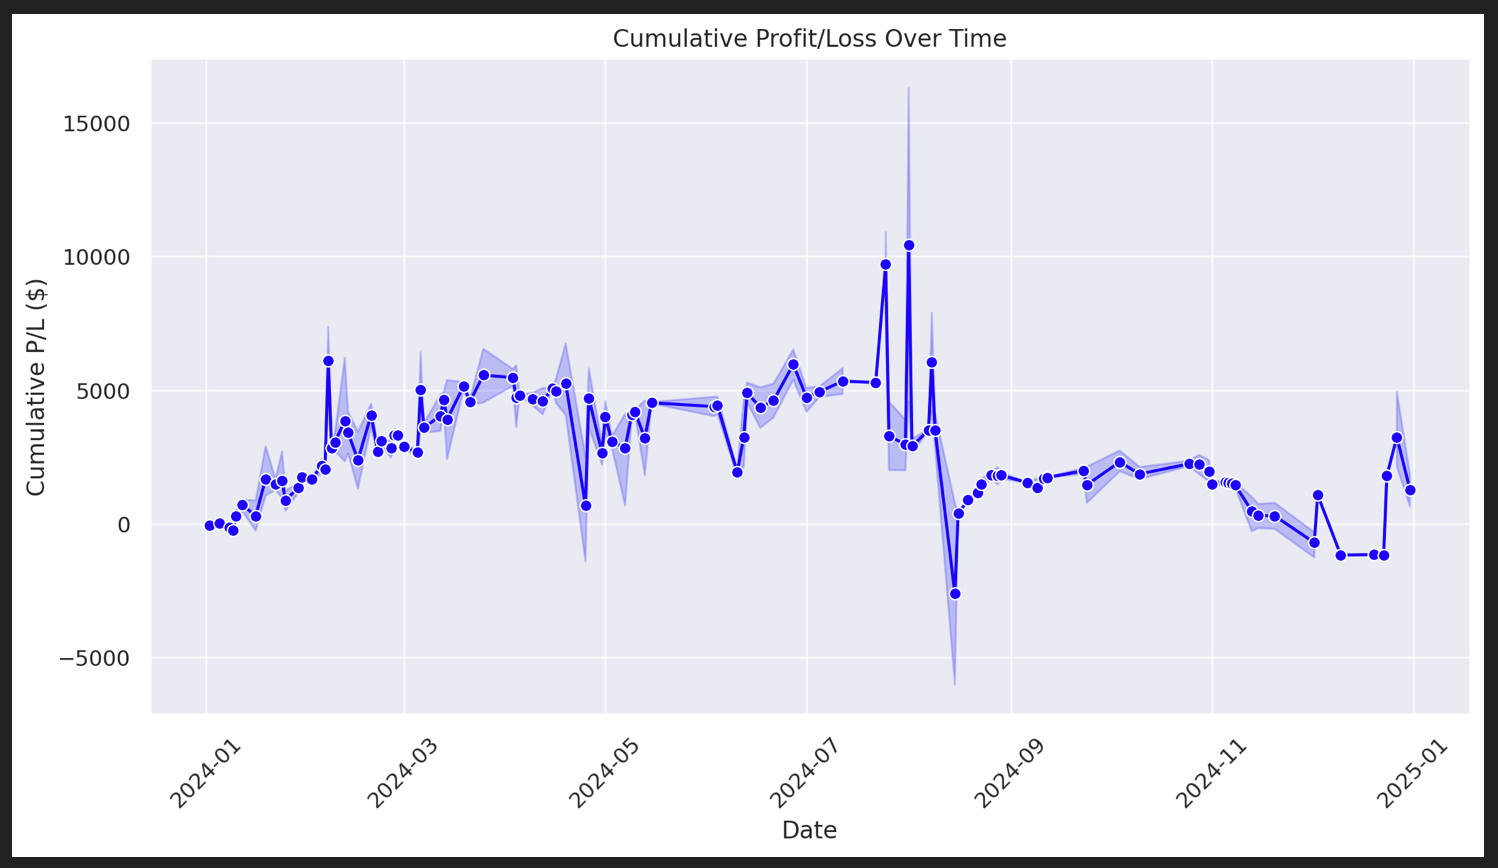
Cumulative Profit/Loss Over Time (📈)

- P/L steadily increased early in the year.
- There were sharp spikes and dips, indicating a few big wins and losses.
- A major drawdown occurred around late summer, possibly from a big losing trade.
- After that, performance fluctuated but stabilized.
Conclusion
This year, if I manage to retain my winnings so far, I am on track to beat my previous year's Option trade wins. My account's current YTD value is $1821.71, see my journal for today, here: https://www.foolishtrader.com/day-21-and-we-wait/.
I intend to publish a similar article next year, taking my 2025 trades through the same analysis. It will be interesting to see the findings.

